Strata Capital

Strata Capital

Strategic Wealth Management | Fairfield, NJ

  • The Firm
  • Our Approach
  • Our Services
    • For Corporate Professionals
    • For Entrepreneurs
    • For MetLife Employees
  • Why Us?
  • Insights
  • Contact Us
  • Client Login
  • Book Your Coaching Session
  • Strata Capital Home
  • The Firm
  • Our Approach
  • Our Services
    • For Corporate Professionals
    • For Entrepreneurs
    • For MetLife Employees
  • Why Us?
  • Insights
  • Contact Us
  • Client Login
  • Book Your Coaching Session
  • Strata Capital Home
  • Skip to main content

Uncategorized

Municipal Bonds vs. Taxable Bonds: Which One is Right for You?

Municipal Bonds vs. Taxable Bonds: Which One is Right for You?

Making Smart Investment Decisions

When choosing between tax-free municipal bonds and taxable bonds, the decision isn’t as simple as picking the one with the highest yield. Taxes play a huge role in your actual return. A taxable bond might look better on paper, but once taxes take a bite out of your earnings, a tax-free municipal bond could be the better option. That’s where the Tax-Equivalent Yield Formula comes in. This simple formula helps investors compare bonds fairly and determine the best choice for their portfolio. Let’s break it down.

Municipal Bonds vs. Taxable Bonds: The Key Differences

Municipal Bonds (“Munis”)

  • Issued by state and local governments
  • Tax-free interest at the federal level (and often state level, too)
  • Typically lower yields than taxable bonds
  • Ideal for investors in higher tax brackets

Taxable Bonds

  • Issued by corporations or the U.S. Treasury
  • Interest is subject to federal taxes
  • Generally offer higher yields than municipal bonds
  • May be better for lower-income investors who pay less in taxes

To determine which bond actually provides the better return, we need to factor in taxes.

The Tax-Equivalent Yield Formula

This formula converts a tax-free municipal bond yield into its equivalent taxable yield:

Tax-Equivalent Yield = Tax-Free Yield ÷ (1 – Tax Rate)

This allows you to compare a tax-free bond with a taxable bond on an equal basis.

Example Calculation

Let’s assume a municipal bond offers a 3 percent yield and your federal tax rate is 32 percent. Using the formula:

3% ÷ (1 – 0.32) = 3% ÷ 0.68 = 4.41%

This means a taxable bond must yield more than 4.41 percent to be a better investment than the tax-free municipal bond.

Real-World Example: Comparing After-Tax Returns

Let’s say you’re choosing between:

  • A municipal bond with a 3 percent tax-free yield
  • A taxable bond with a 5 percent yield
  • A 32 percent federal tax rate

Step 1: Calculate the Income from Each Bond

Municipal Bond: $10,000 x 3% = $300 tax-free income
Taxable Bond: $10,000 x 5% = $500 gross income

Step 2: Subtract Taxes from the Taxable Bond

Since the taxable bond’s interest is subject to a 32 percent federal tax, the tax owed is:
$500 x 32% = $160 in taxes
After-tax income from the taxable bond:
$500 – $160 = $340

Step 3: Compare the After-Tax Returns

Municipal Bond: $300 tax-free
Taxable Bond: $340 after taxes

In this scenario, the taxable bond provides a higher after-tax return.

What If You’re in a Higher Tax Bracket?

Now, let’s assume you are in the highest federal tax bracket (37 percent) and also pay 8 percent in state taxes, for a total tax rate of 45 percent. Using the same $10,000 taxable bond investment, the taxable income remains:

$500 gross income

Step 1: Calculate Taxes Owed

$500 x 45% = $225 in taxes
After-tax income from the taxable bond:
$500 – $225 = $275

Step 2: Compare Again

Municipal Bond: $300 tax-free
Taxable Bond: $275 after taxes

Now, the municipal bond provides the better after-tax return.

Key Takeaway

The higher your tax bracket, the more valuable tax-free municipal bonds become. Investors in high-income brackets should strongly consider municipal bonds to reduce their tax burden.

How to Choose the Right Bond for Your Portfolio

  1. Your Tax Bracket: If you’re in a lower tax bracket, taxable bonds may provide higher after-tax returns. If you’re in a higher tax bracket, municipal bonds often provide better value due to tax-free interest.
  2. Your Investment Goals: If your priority is maximizing income, taxable bonds may offer higher overall returns. If your goal is tax efficiency and risk reduction, municipal bonds could be the better choice.
  3. Your State’s Tax Policy: Some states exempt municipal bond interest from state taxes, further increasing their appeal.
  4. Diversification Strategy: Many investors hold both types of bonds to balance tax efficiency and yield.

Make an Informed Bond Investment

Choosing between municipal and taxable bonds isn’t just about comparing interest rates—it’s about understanding how taxes impact your bottom line. By using the Tax-Equivalent Yield Formula, you can accurately determine which bond offers the better after-tax return.

Key Takeaways

  • Municipal bonds offer tax-free income, making them attractive for high earners.
  • Taxable bonds often provide higher yields, but taxes can erode returns.
  • The higher your tax bracket, the more valuable municipal bonds become.
  • The Tax-Equivalent Yield Formula helps you make an informed decision.

Before making any bond investment, consult with a financial professional to ensure your strategy aligns with your long-term financial goals. For personalized wealth management solutions, reach out today. And, for more information watch the video above and subscribe to our YouTube channel.

Municipal Bonds vs. Taxable Bonds: Which One is Right for You?

By Carmine Coppola

Making Smart Investment Decisions

When choosing between tax-free municipal bonds and taxable bonds, the decision isn’t as simple as picking the one with the highest yield.

Taxes play a huge role in your actual return. A taxable bond might look better on paper, but once taxes take a bite out of your earnings, a tax-free municipal bond could be the better option.

That’s where the Tax-Equivalent Yield Formula comes in. This simple formula helps investors compare bonds fairly and determine the best choice for their portfolio.

Let’s break it down.

Municipal Bonds vs. Taxable Bonds: The Key Differences

Municipal Bonds (“Munis”)

Issued by state and local governments
Tax-free interest at the federal level (and often state level, too)
Typically lower yields than taxable bonds
Ideal for investors in higher tax brackets

Taxable Bonds

Issued by corporations or the U.S. Treasury
Interest is subject to federal taxes
Generally offer higher yields than municipal bonds
May be better for lower-income investors who pay less in taxes

To determine which bond actually provides the better return, we need to factor in taxes.

The Tax-Equivalent Yield Formula

This formula converts a tax-free municipal bond yield into its equivalent taxable yield:

Tax-Equivalent Yield = Tax-Free Yield ÷ (1 – Tax Rate)

This allows you to compare a tax-free bond with a taxable bond on an equal basis.

Example Calculation

Let’s assume a municipal bond offers a 3 percent yield and your federal tax rate is 32 percent.

Using the formula:

3% ÷ (1 – 0.32) = 3% ÷ 0.68 = 4.41%

This means a taxable bond must yield more than 4.41 percent to be a better investment than the tax-free municipal bond.

Real-World Example: Comparing After-Tax Returns

Let’s say you’re choosing between:

A municipal bond with a 3 percent tax-free yield
A taxable bond with a 5 percent yield
A 32 percent federal tax rate

Step 1: Calculate the Income from Each Bond

Municipal Bond: $10,000 x 3% = $300 tax-free income

Taxable Bond: $10,000 x 5% = $500 gross income

Step 2: Subtract Taxes from the Taxable Bond

Since the taxable bond’s interest is subject to a 32 percent federal tax, the tax owed is:

$500 x 32% = $160 in taxes

After-tax income from the taxable bond:

$500 – $160 = $340

Step 3: Compare the After-Tax Returns

Municipal Bond: $300 tax-free
Taxable Bond: $340 after taxes

In this scenario, the taxable bond provides a higher after-tax return.

What If You’re in a Higher Tax Bracket?

Now, let’s assume you are in the highest federal tax bracket (37 percent) and also pay 8 percent in state taxes, for a total tax rate of 45 percent.

Using the same $10,000 taxable bond investment, the taxable income remains:

$500 gross income

Step 1: Calculate Taxes Owed

$500 x 45% = $225 in taxes

After-tax income from the taxable bond:

$500 – $225 = $275

Step 2: Compare Again

Municipal Bond: $300 tax-free
Taxable Bond: $275 after taxes

Now, the municipal bond provides the better after-tax return.

Key Takeaway

The higher your tax bracket, the more valuable tax-free municipal bonds become. Investors in high-income brackets should strongly consider municipal bonds to reduce their tax burden.

How to Choose the Right Bond for Your Portfolio

  1. Your Tax Bracket: If you’re in a lower tax bracket, taxable bonds may provide higher after-tax returns. If you’re in a higher tax bracket, municipal bonds often provide better value due to tax-free interest.
  2. Your Investment Goals: If your priority is maximizing income, taxable bonds may offer higher overall returns. If your goal is tax efficiency and risk reduction, municipal bonds could be the better choice.
  3. Your State’s Tax Policy: Some states exempt municipal bond interest from state taxes, further increasing their appeal.
  4. Diversification Strategy: Many investors hold both types of bonds to balance tax efficiency and yield.

Make an Informed Bond Investment

Choosing between municipal and taxable bonds isn’t just about comparing interest rates—it’s about understanding how taxes impact your bottom line.

By using the Tax-Equivalent Yield Formula, you can accurately determine which bond offers the better after-tax return.

Key Takeaways

  • Municipal bonds offer tax-free income, making them attractive for high earners.
  • Taxable bonds often provide higher yields, but taxes can erode returns.
  • The higher your tax bracket, the more valuable municipal bonds become.
  • The Tax-Equivalent Yield Formula helps you make an informed decision.

Before making any bond investment, consult with a financial professional to ensure your strategy aligns with your long-term financial goals.

For personalized wealth management solutions, reach out today. And, for more information watch the video above and subscribe to our YouTube channel.

Strata Capital is a wealth management firm serving corporate executives, professionals, and entrepreneurs in the New York Tri-State Area, focusing on corporate benefits and executive compensation. Co-founded by David D’Albero and Carmine Coppola, the firm specializes in making the complex simple to ensure clients feel confident in their financial decisions. They can be reached by phone at (212) 367-2855, via email at carmine@stratacapital.co, or by visiting their website at stratacapital.co.

Cornerstone Planning Group, Inc., (“CSPG”) is an SEC registered investment advisory firm. The information contained herein should not be construed as personalized investment advice and should not be considered as a solicitation for investment advisory service. The information (e.g., tax ) provided is believed to be accurate however CSPG does not guarantee or otherwise warrant such information. For more information regarding CSPG you can refer to the Investment Adviser Public Disclosure website (www.adviserinfo.sec.gov) and review our Form ADV Brochure and other disclosures.

The opinions voiced in this material are for general information only and are not intended to provide specific advice or recommendations for any individual.

The Effect of a Recession on Your Financial Situation

The thought of a recession can strike fear into the hearts of new investors or families in an uncertain financial situation. Though this downturn in the economy presents some distinct challenges, it doesn’t have to spell disaster. With a thoughtful allocation of funds and patient money management, you can weather this type of storm more comfortably than you may have imagined.

How Can You Tell That We’re in a Recession?

A recession typically occurs when there are two consecutive calendar quarters of negative real Gross Domestic Product (GDP). The overall decline may last for months or even years. Though there are several other indicators that point toward a recession, consecutive quarters of retraction are considered one of the most reliable signs. A recession was declared for each of the last 10 times the U.S. economy shrank for two consecutive quarters.

Some other indicators of a recession include:

  • An increase in unemployment
  • Changes to the yield curve such that short-term government bonds pay more than long-term ones
  • Decline in retail sales
  • Decline in the ISM manufacturing index
  • Rising commodity prices
  • Rising inflation

How Do Recessions Occur?

Recessions are commonly triggered by a number of simultaneous business failures. As a result, companies have to cut back on workers and production. Spending and investment slow down. This in turn causes the GDP to decline. As companies respond by tightening their belts and laying off workers, unemployment begins to rise.

The U.S. has experienced eight recessions since 1969. These were preceded by economic imbalances. An expansion usually comes before a recession, but it’s nearly impossible to predict exactly when the economy will turn. A financial bubble, fast-paced inflation, or a shock to the economy like a spike in oil prices can all tip the scales. When the recession occurs, interest rates, commodity prices, and inflation all go on the rise.

How Long Do Recessions Typically Last?

Recessions usually last somewhere between six and 12 months. The last eight recessions to hit the U.S. economy averaged over 10 months in length, though the most recent one was very brief, lasting just two months. A recession is over when the economy shows signs of growth again. However, this growth may occur very slowly, leaving individuals and businesses to face a lengthy recovery period. For context, here are some details on the length of prior recessions:

  • December 1969 to November 1970: 11 months
  • November 1973 to March 1975: 16 months
  • January 1980 to June 1980: 6 months
  • July 1981 to November 1982: 16 months
  • July 1990 to March 1991: 9 months
  • March 2001 to November 2001: 8 months
  • December 2007 to June 2009: 19 months
  • February 2020 to March 2020: 2 months

How Will a Recession Affect My Portfolio and Investments?

Portfolio diversification will play a major role in determining how your portfolio balance will be impacted by a recession. A balanced portfolio consisting of stock and bonds will often experience less downturn from a recession than a portfolio invested solely in stocks. That’s because stocks and bonds typically do not move in the same direction. The most recent exception to this was last year in 2022 when both stocks and bonds ended the year negative. This was due to the Fed’s decision to raise rates quickly to combat high inflation. A case like this is rare and has only been seen once since 1970. That being said, building a diversified portfolio consisting of many different asset classes will help to mitigate large swings in portfolio value in most cases.

Though pullbacks may seem alarming, it’s important to recognize that these are usually temporary and often necessary. In 21 of the last 26 years, the U.S. equity markets finished positive, even though the average annual pullback was -15.2% intra-year. For most, the best strategy for dealing with a market downturn is patiently waiting for the market to recover and not making any rash decisions that causes you miss a recovery.

How Does This Affect My Financial Plans and Goals?

If your investment portfolio is aligned with your risk tolerance, a recession shouldn’t affect your long-term plans and goals. An investor planning to purchase a home within the next year wouldn’t be heavily invested in high-risk equities. Thus, the recession would not have a notable impact on their financial situation. On the other end of the spectrum, if your goals are long-term with a higher risk tolerance, you will likely be able to weather the recession and wait patiently for the economy to recover before you seek to cash in on your investments.

If you already have some cash on the sidelines, have a longer time horizon, and are in a strong financial position, you may want to use a recession as a buying opportunity. Recessions typically lead to depressed equity pricing for a period of time, this opportunity doesn’t come often, but when it does, you’ll be able to get in at lower prices.

You should only use this strategy if you have ample emergency savings and you can afford to wait at least several years for a return on your investment. A recession is not a good time to check obsessively on your portfolio looking for returns. Rather, this is a period for quiet patience.

What Should I Do If I’m Not Prepared for a Recession?

If you haven’t prepared mindfully for a recession, you should do a deep dive into your finances to get a solid idea of where you stand. It’s important to have a clear understanding of all your assets and investments during this time. If you find yourself in a difficult situation during the recession, you may need to push some of your goals forward, particularly if you’re looking toward a major purchase like a new home.

In some cases, individuals who felt they were in serious trouble discovered that their situations were more manageable than they thought. Even minor adjustments can have a measurable impact on your financial situation. If you’re feeling anxious about your finances, seek the help of a financial professional. Running a detailed analysis of your situation will give you the information that you need to move forward wisely and care for your future in the best way possible.

Don’t let fear overcome you in the face of uncertain economic times. With an experienced financial advisor on your side, you can make it through a recession safely, keeping your assets well protected and your goals close at hand. Working with us here at Strata Capital, you’ll gain the insights you need to make wise choices moving forward that will help you cope successfully with whatever the recession may throw at you.

Risk Tolerance & Your Investment Strategy

With the current economic climate, we thought it would be the perfect time to discuss risk tolerance and how it relates to investor behavior. Without an intentional strategy that reflects your personal goals, times of turmoil (and growth, for that matter) can influence financial decisions in a way that’s not always beneficial. That’s why it’s important to identify your own risk tolerance and understand how it relates to your investment strategy.

What is Risk Tolerance?

Risk tolerance is a measure of how much decline an investor is willing to accept in their portfolio in exchange for a given amount of expected positive return. Essentially, it’s how much loss someone is willing to risk in exchange for what is expected to be a greater return.

When developing a portfolio, investors with a low risk tolerance typically rely more on conservative assets like cash equivalents, bonds or other types of fixed income, whereas investors with a high risk tolerance might lean more heavily on stocks. When it comes to risk tolerance and portfolio allocation, there are five commonly accepted target stock allocations (or equity allocations):

  • Aggressive: 80-100% of investments in equities
  • Moderately Aggressive: 60-80% in equities
  • Moderate: 50-60% in equities
  • Moderately Conservative: 30-50% in equities
  • Conservative: 0-30% in equities

Using these guidelines, the goal is to invest according to an investor’s risk tolerance. So if someone isn’t willing to tolerate much risk, they might invest, say, 35% of their portfolio in stocks. The remaining percentage would be invested in a mix of bonds, fixed income, or alternatives like commodities, hedge funds, venture capital, real estate, or money market funds. Alternative investments can help mitigate volatility in a portfolio because they are typically less correlated to other asset classes.

Skewed Perceptions

An issue arises when investors don’t fully understand the level of risk involved with specific investments, or they base their tolerance for risk on positive experiences.

For example, super bull markets often create a sense of security for non-professional investors that causes them to invest their hard-earned savings in investments that have greater risk than they realize. That’s because the only trend the investor has seen are those securities rising in value for long periods of time. And while there are always intra-year lows with these types of investments, the market has typically bounced back very quickly, which only adds to an investor’s confidence. Consequently, some investors believe they can tolerate higher-risk investments because they’ve only seen the positive consequences of those investments.

Unfortunately, risk tolerance isn’t meant to be a measure of the “good times.” It’s meant to measure how much loss an investor can stomach in volatile seasons like we’re experiencing now, or in major market meltdowns like the financial crisis of 2008.

Evaluating Your Risk Tolerance

So how can an investor determine their true risk tolerance? There are several factors to consider, but one method is to complete a risk tolerance questionnaire like the one we’ve included below. In general, you should ask yourself the following questions:

  • Did I feel anxious during the most recent downturn? (If you’re considering selling because of the recent volatility, that might be a sign you’re invested more aggressively than you should be.)
  • Have I “fear sold” recently?
  • Do I prefer to wait to invest until the market looks healthier?

graphic

Answering these questions will give you a better idea of your tolerance for risk in the market, which will help you choose investments that are compatible with your risk tolerance and goals.

Time Horizons & Risk Tolerance

A person’s risk tolerance can vary according to their goals. For example, if someone is saving money for retirement, their risk tolerance will likely be higher the further out they are from retirement and get more conservative as they get closer. This allows for the investor to avoid seeing a big decline in their account upon entering retirement. That’s why it’s important to consider your time horizon—this is the amount of time you can hold an investment before you need to sell it to meet a cashflow need or to accomplish a financial goal.

There are two types of time horizons: an income cashflow time horizon and a lump-sum time horizon.

Income cashflow time horizons correlate with an investor’s need to generate income during a long period of time (retirement being the most common example of this). When someone is planning for retirement, the most common (and often recommended) strategy is to invest money in a vessel designed to support long-term income (rather than invest money throughout your life, sell those investments when you retire, and live off the profit). The goal is for the funds to last throughout the investor’s lifetime and keep pace with inflation in the process. When implemented well, this strategy should leave the investor with money left over at the end of their life, allowing them to leave something behind for their beneficiaries.

A lump-sum time horizon, on the other hand, is used when someone invests money into something with the intention of selling it at the end of a predetermined period. For example, someone might purchase a vacation home or other property with the intention of selling it after 15 years or so.

Whatever your goals, it’s important to understand how your time horizon plays into your investment strategy. If mismanaged, you could face some disappointing consequences when it comes time for you to meet your goal. For example, if you need to see a return in a short period of time but you’re too aggressive with your investments, you might lose too much money and run out of time to gain it back. Conversely, if you’re too conservative with a long-term goal, you might reach the end of your time horizon without having met your desired return.

The Takeaway: The purpose of your investments helps you determine your time horizon.

Incorporating Risk Tolerance Into Your Financial Plan

Most people have more than one financial goal; consequently, your time horizon and risk tolerance might look different for different buckets of money you allocate to accomplish specific goals. (For example, if you need cash from an investment in less than two years, your risk tolerance and strategy will look different for this goal than it will for your long-term retirement goal.)

Once you determine when you need to spend your money, you can select investments that match those timeframes. We recommend working with a financial advisor and completing a cashflow worksheet to determine how much you can and should save to accomplish your goals.

The earlier you plan, the earlier you can begin saving—which allows you to leverage the market to help you save. And the more return you can earn from market growth, the less of your money you’ll need to fund your goal.

graphic

The Takeaway: Choosing investments should be done only after you know your time horizon and risk tolerance.

I Bonds: Preserving Your Purchasing Power When Inflation is on the Rise

It’s no secret: inflation is on the rise. And while it’s been a popular topic of conversation and speculation, the important thing is to understand how it affects your long-term financial plan and what you can do to maximize the value of your dollar.

One downside to inflation is that any cash you leave in a bank account loses its purchasing power over time. The primary way to combat this issue is to invest the cash so it has the opportunity to yield a greater return, helping your money keep pace with inflation. Of course, there are risks to investing in the stock market, so you might look for safer options to preserve your purchasing power.

That’s where I bonds come into play—these bonds can enhance your overall financial plan by providing a safer way to earn a yield that keeps pace with inflation.

What is an I Bond?

I bonds are a type of U.S. savings bond that are designed to help investors’ savings keep pace with inflation. They do so by leveraging a composite interest rate composed of both a fixed rate and an inflation rate that changes every six months according to fluctuations in inflation.

How Can I Bonds Improve My Portfolio?

The primary benefit of I bonds is that they help your savings earn more interest during times of high inflation. They’re also a safe investment because they’re issued by the U.S. Treasury, and as long as inflation rates are high, they can provide the highest yield of any government security.

I bonds also offer some tax benefits—they’re exempt from state and local taxes, so investors only have to pay federal income tax on their I bonds’ interest. You can choose to pay the tax annually, at maturity, or when the bond is cashed. If you use I bonds to fund college tuition, they can be completely tax free, making them an attractive option for a college savings plan.

How Are I Bonds’ Interest Rates Determined?

I bonds earn interest monthly and are compounded semiannually. Once purchased, each I bond’s interest rate will adjust every six months from the date it was issued according to the current inflation rate. To determine an I bond’s interest rate, the U.S. Treasury uses a composite rate based on two factors:

  • Fixed Rate: The Treasury announces the fixed rate every six months. This rate applies to new bonds issued during the following six months, and it does not change during the life of the bond.
  • Inflation Rate: The Treasury establishes the inflation rate every six months (in May and November) based on the Consumer Price Index for All Urban Consumers (CPI-U). This rate can (and usually does) change every six months.

I bonds’ interest rates are then calculated with the following formula: [Fixed Rate + (2 x Semiannual Inflation Rate) + (Fixed Rate x Semiannual Inflation Rate)] = Composite Rate. The current rate for I bonds (through May 1st, 2022) is 7.12%.

One benefit of I bonds is that the composite rate will never be below zero—however, in periods of deflation, it can be lower than the fixed rate. Similarly, while the fixed rate (which is constant for the lifetime of the bond) can provide some stability, it can become a disadvantage for I bond investors if interest rates increase—because they won’t benefit from the higher fixed rate.

How Can I Implement I Bonds in My Financial Plan?

You can purchase I bonds from the U.S. government on the TreasuryDirect website. Each year, investors are allowed to purchase up to $10,000 in I bonds directly, plus an additional $5,000 with their tax return (equaling $15,000 total). I bonds have a 30-year maturity term, but investors can cash out prior to the maturity date. However, there are some stipulations to cashing out early:

  • You must hold an I bond for at least one year before you can cash out.
  • To receive all your earned interest, you must hold the bond for a minimum of five years. If you cash out between years two and five, you lose the previous three month’s interest.

How Do I Know if I Bonds are Right for Me?

Like most financial strategies, the key is to be informed about your decision. It’s important to understand how I bonds will affect your overall financial plan. You’ll want to consider the interest rate and how it can change, the tax impact (like how you’ll be taxed and when), and the penalties for cashing out early.

If you’re curious about I bonds and other ways to preserve your purchasing power during periods of high inflation, we’d love to speak with you. As financial advisers, we can show you both the short- and long-term impact of using I bonds and help you determine if they’re an advantageous addition to your plan. If you’d like to know more about I bonds or want to review your financial strategies, you can schedule a meeting with one of our advisers here.

This article is intended to be for general information about the topic(s) described only, and should not be used as financial advice specific to your situation. For financial advice pertinent to your lifestyle, goals, risk tolerance and opportunities, please contact a financial professional.

What is a Net Unrealized Appreciation (NUA) Strategy?

When it comes to retirement planning, there are several strategies employers use to help their employees save money for the future. Most employers, particularly publicly traded companies, offer employees some sort of retirement plan like a 401(k). Many of these companies also offer an option to purchase company stock as part of the employer-sponsored plan. Some companies also pay employees with stock by contributing shares to their retirement plan.

There are lots of different company retirement strategies, and when participating in any of them as an employee, it’s important to know how you’ll be affected by taxes. All the plans mentioned above are tax deferred, meaning you pay taxes on the distributions, rather than on the initial contribution.

IRS Code Section 402 allows plan participants the opportunity to pay a lower tax rate when they take lump-sum distributions of company stock from an employer-sponsored plan. This is referred to as a Net Unrealized Appreciation (NUA) strategy, and in this blog, we’ll discuss how it works, who’s eligible to use it, and how to know if it might be beneficial for you.

What’s the Benefit of using an NUA strategy?

When you take a distribution from a tax-deferred retirement plan (like a 401k or IRA), the amount you withdraw is treated as ordinary income and is therefore taxed at ordinary income-tax rates, which can be as high as 39.6%. For example, let’s say you had $500,000 worth of company stock in your plan and the amount you paid for the shares was $100,000. If you were to take a $500,000 distribution as cash, then the entire amount—including the appreciated $400,000—would be taxed at ordinary income-tax rates.

An NUA strategy, on the other hand, allows plan participants to pay a capital gains tax rate (which is just 15% for most individuals) on the unrealized appreciation of the stock (in this example, $400,000) from the employer-sponsored plan.

How it works

An NUA strategy allows you to distribute the shares from an employer sponsored plan into a taxable brokerage account. When you do this, you still have to pay regular income tax, but only on the cost basis of your shares (which, in the example above, is $100,000). The appreciation of the stock ($400,000) would then be subject to long-term capital gains tax rates, which you would pay when you sold the shares. (There is no requirement to sell the shares; you can hold them as long as you like, sell some of them, or sell all of them.)

What if I have other funds in my retirement plan besides company stock?

One of the qualifications to use an NUA strategy is that your entire plan balance–including any cash or other funds in addition to the company stock–must be rolled over within the same calendar year. Fortunately, if you have cash or other funds in your account and want to leverage an NUA strategy, you can roll over the remaining funds into an IRA, thus retaining their tax-deferred status.

Here’s an example of how that would work:

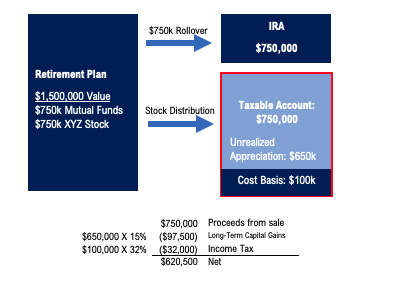
Tom recently retired from XYZ Corp, a tech company that has seen massive growth in the 30 years Tom worked there. Tom participated in the company-sponsored retirement plan, and his account is currently worth $1,500,000. Below are the assets in his plan:

  • $750,000 in various mutual funds
  • $750,000 in XYZ Corp stock (Cost basis is $100,000)

Tom has always wanted to buy a vacation home on the beach and has finally decided to pull the trigger. He wants to use his company stock to pay for the beach house, since he thinks it’s time to diversify his holdings anyway. He is in the 32% federal tax bracket.

Tom collaborates with his accountant and his financial adviser, and together, they decide that an NUA strategy would save him a significant amount of money. Here is what they do:

  • Distribute the stock shares to a taxable brokerage account. Tom pays $32,000 in ordinary income tax on the cost basis of his shares ($100,000 cost basis X his 32% tax rate).
  • Tom sells the stock once it is in the brokerage account and pays $97,500 in long-term capital gains tax ($650,000 unrealized appreciation X 15% long-term capital gains rate). (Note: Tom does not have to sell all the shares. Depending on the price of his beach house, he could sell enough shares to cover the cost and leave the rest until he needed them.)
  • Then, they rollover the remaining plan balance that was invested in various mutual funds ($750,000) into an IRA. Tom will not have to pay taxes on this portion of his plan until he takes a distribution from this account.
  • Tom now has a budget of $620,500 for his beach house! ($750,000 in shares minus $32,000 in income tax, minus $97,500 in capital gains tax—leaves him with $620,500.)

graphic

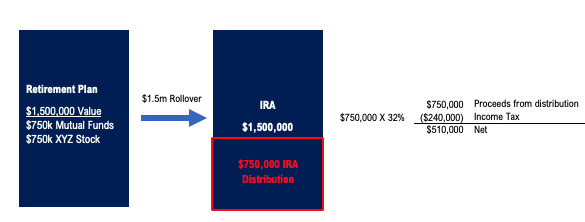
If Tom were to take the $750,000 directly from his plan or IRA (rather than distributing the shares to a taxable brokerage account), he would be required to pay his ordinary income tax rate on the entire amount—$750,000 X 32%—a whopping $240,000 in taxes! But by leveraging an NUA strategy, he saves more than $110,000.

graphic

Who is eligible to use an NUA Strategy?

Below are some stipulations to leverage an NUA strategy:

An individual must be eligible to take a lump-sum distribution from their retirement plan, either by separation of service, reaching age 59 ½, disability, or death of the participant.
The stock must be directly transferred (in kind) to a taxable brokerage account from the employer-sponsored retirement plan. The shares cannot be sold in the retirement plan and rebought in the brokerage; it must be the same shares.

There are some factors that can disqualify a person from using this strategy, so if you’re considering it, it’s best to discuss your options with a financial professional.

How do I know if an NUA strategy is right for me?

Even if you’re eligible to use an NUA strategy, that doesn’t mean it’ll be the right choice for you. There are advantages and disadvantages to this approach, and it’s important to understand both before using it in your plan. Generally, this strategy generally works best for people who are in higher tax brackets and whose stock has greatly appreciated in value.

Ultimately, whether this strategy makes sense for you is dependent on your unique situation. It needs to align with your overarching financial goals and complement the rest of your plan. That’s why it’s extremely important to discuss your options with your financial adviser and tax adviser.

If you want to know more, we’re here to help. Our advisers can help you clarify your goals, give you a better understanding of your financial situation, and help you broach the subject of an NUA strategy with your tax adviser. We’re also happy to run calculations for you free of charge. Call or email to schedule a consultation with one of our advisers today.

This article is intended to be for general information about the topic(s) described only, and should not be used as financial advice specific to your situation. For financial advice pertinent to your lifestyle, goals, risk tolerance and opportunities, please contact a financial professional.

  • Go to page 1
  • Go to page 2
  • Go to Next Page »
Strata Capital

Subscribe to Our Blog

This field is for validation purposes and should be left unchanged.

Disclosures      ADV      CRS

350 Passaic Avenue, Suite 201 | Fairfield, NJ 07004 | 212-367-2855 | Email David | Email Carmine

Copyright © 2025 Strata Capital

Privacy Policy | Terms of Use

Advisory services are provided through Cornerstone Planning Group, LLC, an independent advisory firm registered with the Securities and Exchange Commission.